
Support Center.
Get Started or Become a Pro. Browse our support articles to learn how to get the best out of PeopleGoal.
App Reports & the Data View
Once your app processes are underway, you'll want a way to track and analyze the app data. Every single element on PeopleGoal has a unique ID, and this is stored in the Data view on each app. This means that you can build custom reports using every data point your app, and assess the areas that are most important to your company.
To get started with building reports, open up your app and click the Data tab.
Jump straight to:
Working with the Data View
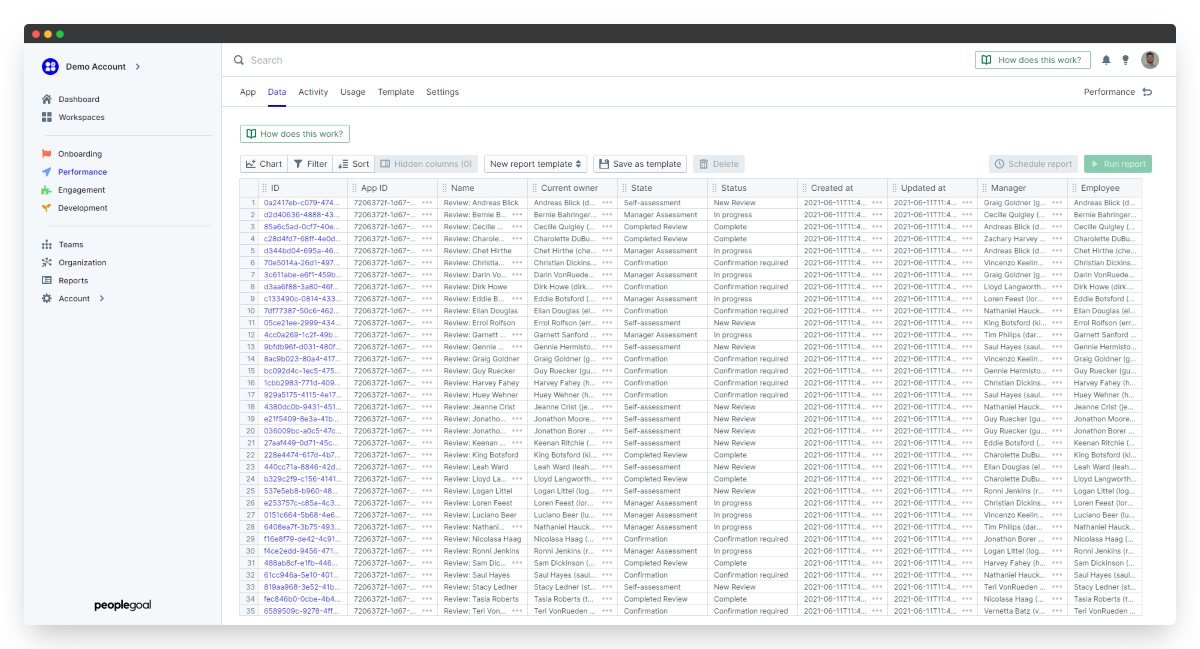
Your app data is stored as a table.
Each row is an item created within an app.
Columns are sorted as:
- Item ID
- App ID (the overall app the item belongs to)
- Item Name (the custom name given to this item by the first participant)
- Current owner (the state participant currently working on the item)
- State (item state)
- Status (item status)
- Created at (date-time stamp when the item was created)
- Updated at (date-time stamp when the item was last submitted to a new state)
- Participant fields (the custom participant titles created in the app template)
- Element fields (every element created in the app template)
Your default view shows every data point in your app. You can then start to filter and sort the spreadsheet, and save these as new templates.
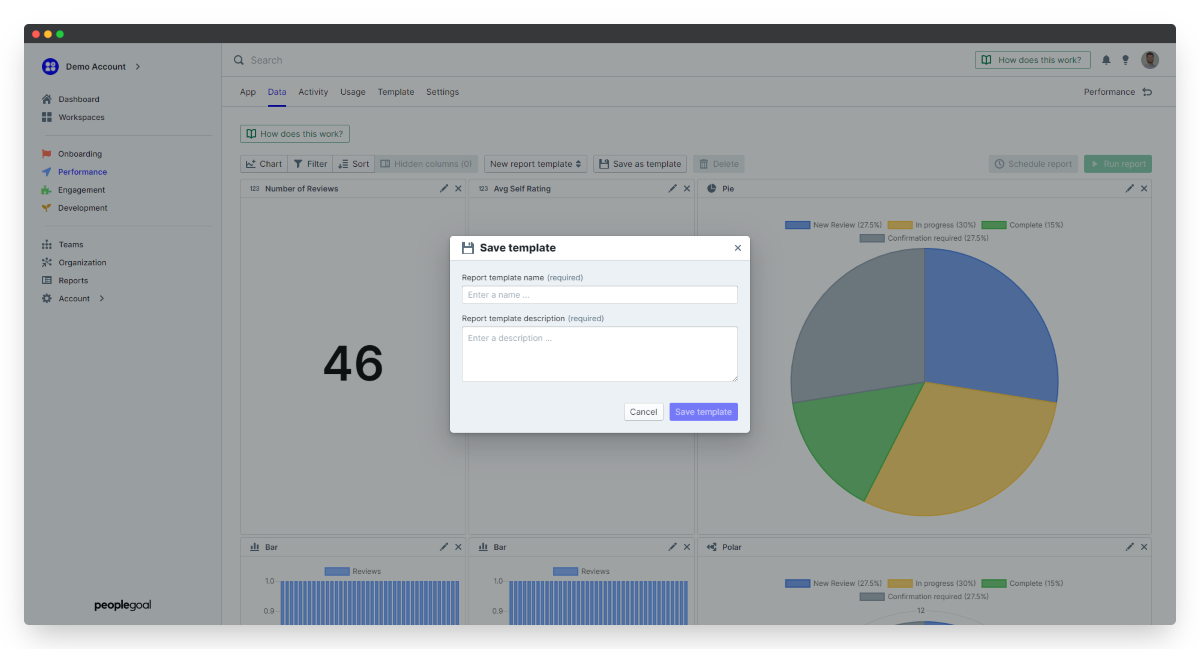
Create a New Report Template
- Open up the Data tab of your App.
- Click New report template from the drop-down list.
- Click Save as template and give your report template a name and description. Always include the App Name here as that will make the report easier to find in the overall Reports view.
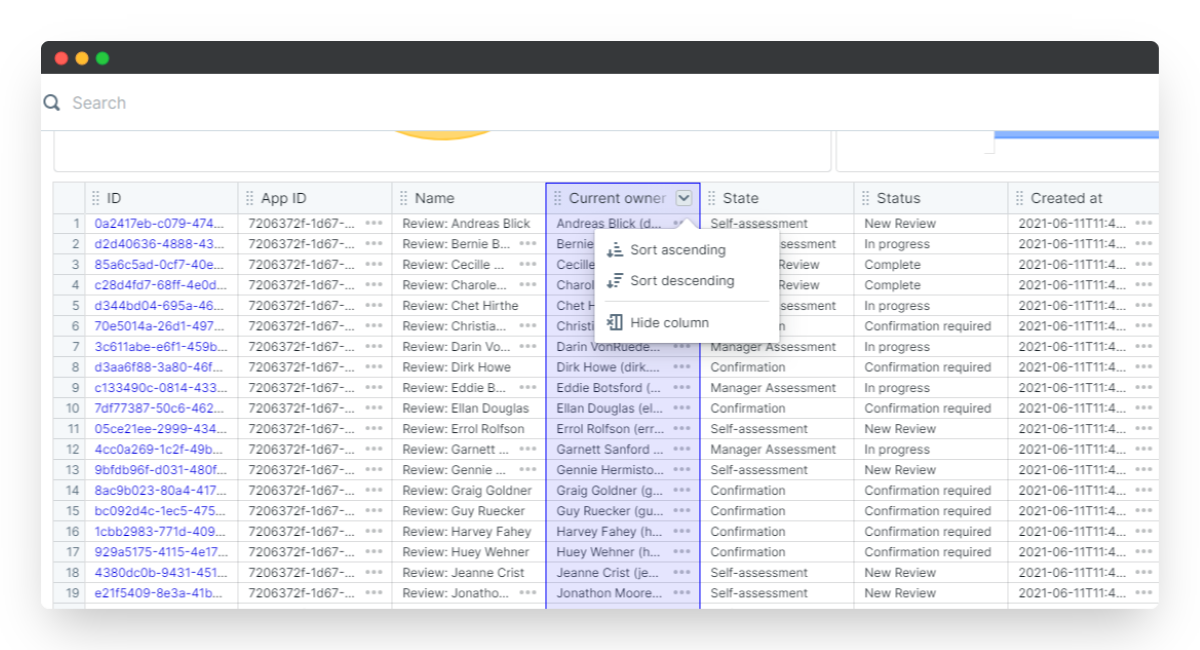
Hide and sort columns
Click on a column title you want to edit. You can hide the column or sort by ascending or descending.
Add a filter
You can also add a report-wide Filter to the data. For example, you might want to look at only completed items and ignore those that have an "In progress" status.
- Click the Filter tab, then Add a new filter.
- Select the element (or column name) to filter by, then choose your operator.
- Type in the paramenter and that will automatically apply to the whole data table.
- Click Save changes to lock in your updates.
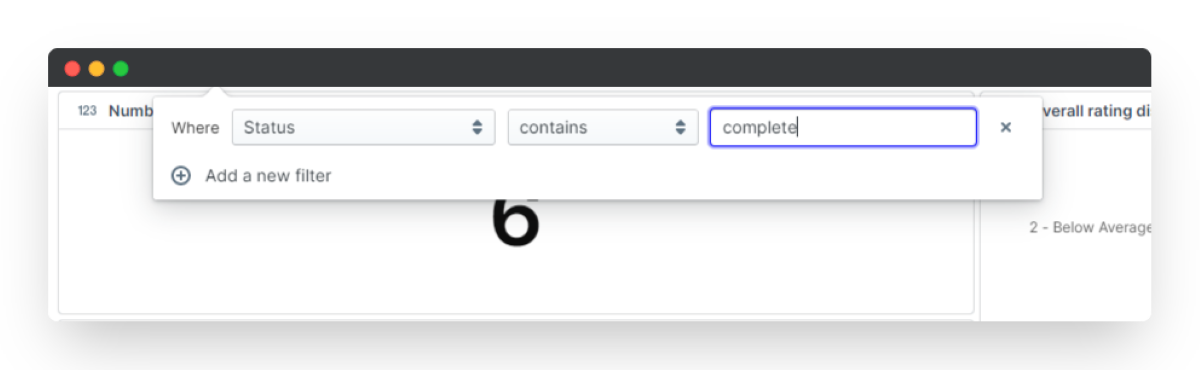
So for our example above, we'd add a filter where "Status" (element) "contains" (operator) "Complete" (parameter), and the whole table will show only items with a completed status.
- You can add any number of filters you need to build out a completely custom report.
- To delete a filter, click the Filters button and click the "x" next to the filter you want to remove.
Set your report visibility
Toggle Public report template on or off to share this report with anyone else in the app. If this button is off, only the person who created the report can view it.
App permissions will control the data visibility. So if you have "Create only" permission within this app, only your own items will show up on this report. If you have "owner" permissions you'll see all item data.
Toggle Default report template on or off to make this the first report users land on when they open up the Data view.
Always remember to save your changes! Reports do not auto-save.
Run Reports
Now that your template is built, all the data will remain up to date any time someone creates or submits a new item. Any time you return to this report in the Data view, it will be the latest version of your app data.
You can also "run a report" at any time to both save a "point in time" copy of your report, and to export it offline.
- To run a new report, open the Data tab of your app.
- Select the report you want to view from the drop-down list.
- Click Run report and we'll generate a new copy of the report template.
- You'll be taken to the Reports area in the lefthand navbar, where you'll see your new report file ready to download.
- You can Open it to view the table in a new tab, or click Export and select a CSV or Excel file type.
- Clicking Delete will delete just this instance of the report from your Reports area, not the entire report template.
You've now started to build a historical record of reports that you can return to anytime by clicking Reports in the navbar.
Of course, this is just the first step in building a custom reporting suite. In the Become a Pro section you'll learn how to work with charts and how to schedule your reports to be automatically sent to designated users on a regular basis.


PeopleGoal Support Team
Account Management & Implementation Specialists


