Employee surveys are the bedrock of evidence-based HR. They allow HR leaders to measure how committed, engaged and satisfied employees are.
However, HR teams accumulate an overwhelming amount of survey data. This information is meaningless if it is not properly analyzed and evaluated.
This article will show you how to interpret data against your company’s objectives so that actionable results are taken.
Use relevant metrics to analyse your employ survey results
You can only make sense of the data you collate using the correct metrics. They are the lens you wear to measure the success of your HR initiatives.
To find your metrics, HR teams should reflect on what their goals are. Jeff Bladt and Bob Filbin argue in Forbes that we need to differentiate between ‘vanity metrics’ and ‘meaningful metrics’. Your team might be flattered by the popularity of an internal social media initiative. However, if job satisfaction and wellbeing are plummeting, consider the relevance of this success.
HR teams’ ultimate goal is often to improve employee engagement. Focus on metrics associated with high engagement, for example, a long-term interest in working for the company, belief in the organization’s values, productivity and satisfaction. Collate data relevant to these indicators and start evaluating from there.
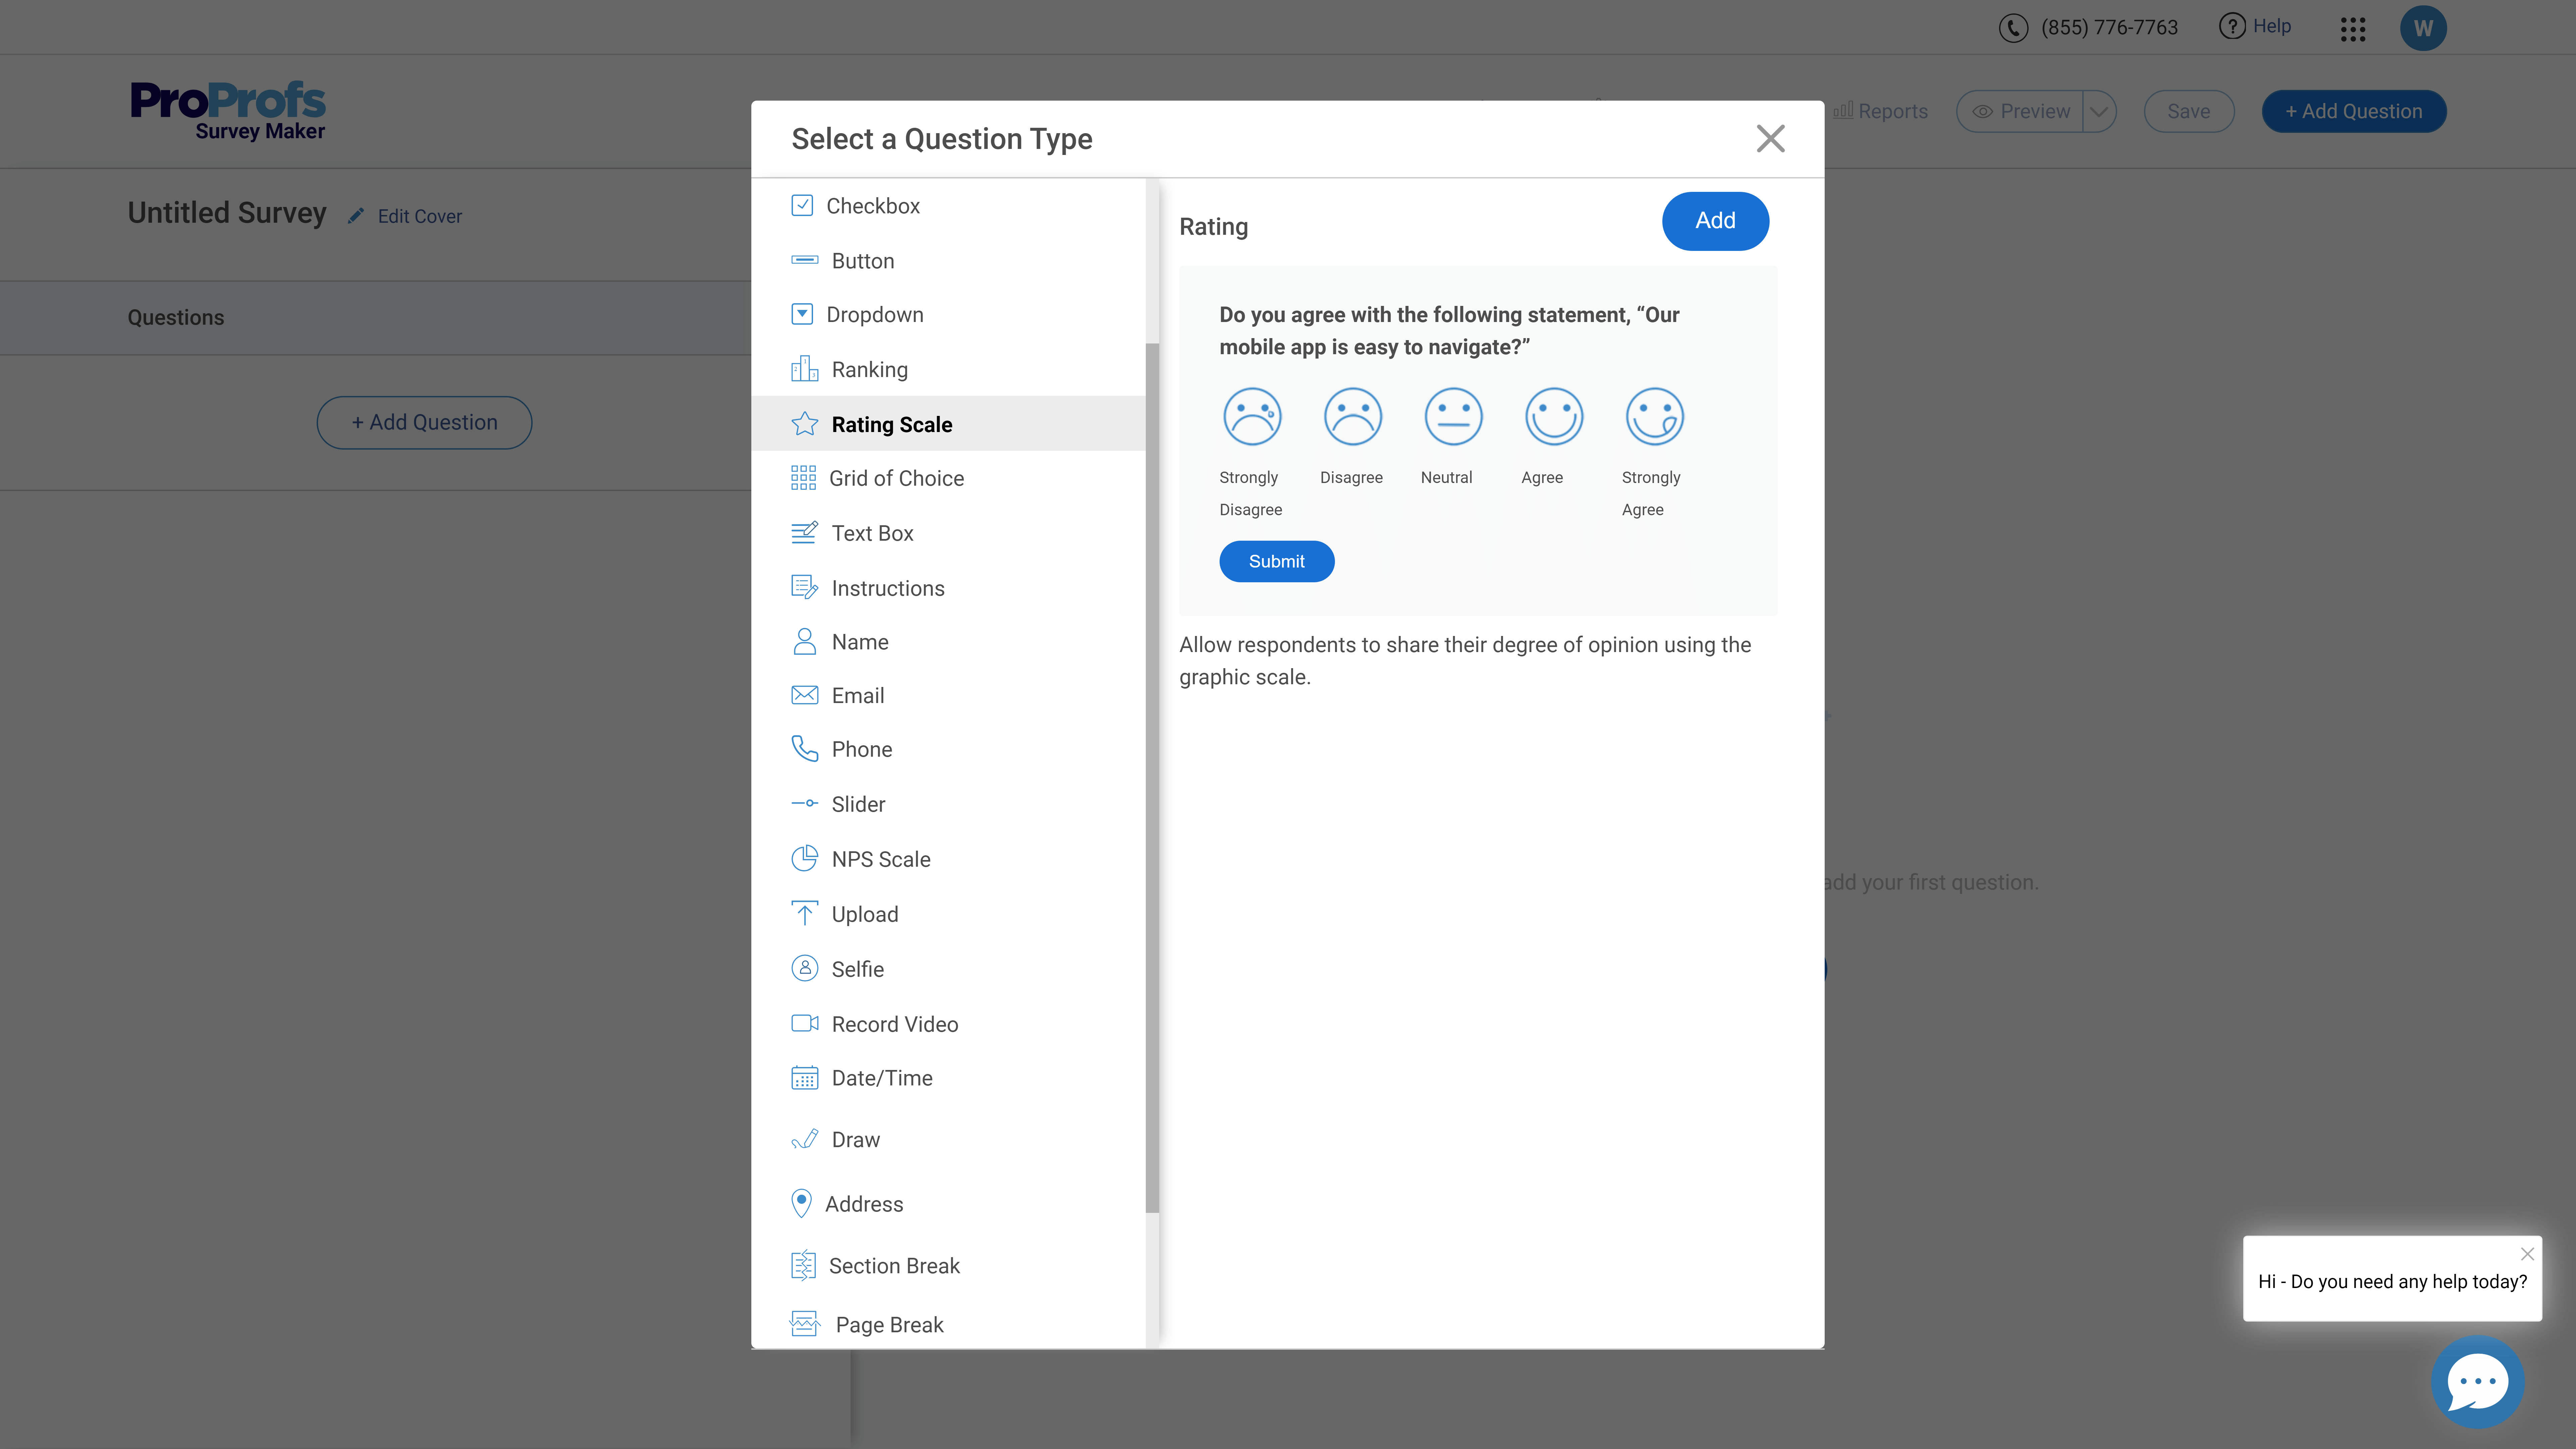
Employee surveys can measure a particular area of employee experience. For example, HR runs pulse surveys on employee engagement, wellbeing or diversity and inclusion. These areas speak volumes about how your organization aligns with its culture and values.
Consider the data in terms of company culture. Group together the survey questions or sections that relate to company trust, work-life balance or employee satisfaction. Use a reporting system to visualize this data.
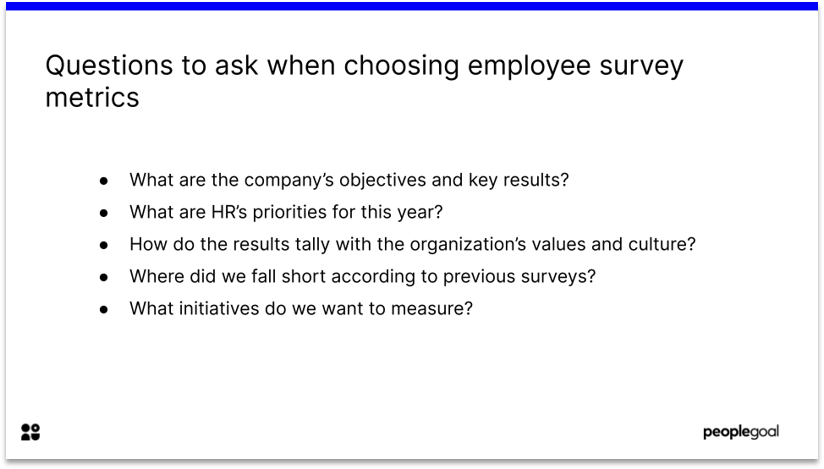
Questions to ask when choosing metrics
- What are the company’s objectives and key results?
- What are HR’s priorities for this year?
- How do the results tally with the organization’s values and culture?
Check the employee participation rate
Don’t forget to measure the employee participation rate of your survey. This helps you to see how effectively your internal communications are working. Maybe your survey was too long? Take notes to improve for the next survey.
Uncover trends
Collate your data using a survey reporting system. Make sure the results are easily visible for your team.
With your results grouped into metrics, trends will emerge. Maybe employee engagement decreased this year?
Think about the different tenures and company levels represented by your survey. Do lower level employees experience burnout more regularly?
Instead of looking at KPIs or other indicators in isolation, e.g. through a ‘wellbeing’ section and an ‘employee relations’ section, compare and contrast these areas.
For example, manager relationships have a domino effect on other aspects of employee experience. According to Gallup, managers account for 70% of the variance in employee engagement.
To cross compare, make sure you use HR software to translate your results into easy to interpret graphics. Our brains process images 60,000 times faster than text. Organize your data into teams if you have this information, or company levels. Are there overlaps in your data that reveal an underlying issue?
The video below, by the University of Minnesota’s Leadership and Talent team, provides some great tips for this process.
Embedded content: https://www.youtube.com/watch?v=DawRdXgWYQg
Watch out for discrepancies
Be critical of the results – can you question the reliability of some results? Was a question worded in a misleading way? Is a broad cross section of your company represented in your survey data? If not, spread the word about your survey before starting the review process, as your results may be too few.
Cross-compare results using benchmarks
Where possible, compare your survey results to those of previous years or quarters. Tabulate this year’s data alongside the data from previous years for particular survey responses. This helps you track trends or improvements in your HR initiatives.
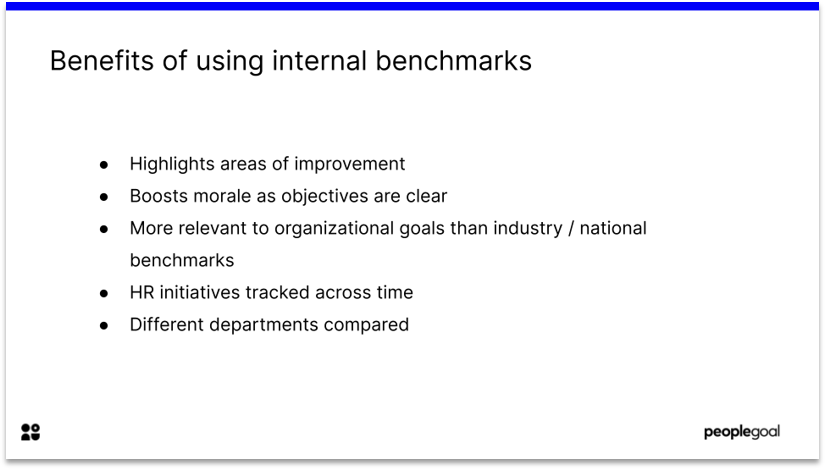
Internal benchmarks measure HR strategy’s strengths and weaknesses.
Cross-comparisons also remind you to contextualize the results.
Secondly, compare the results of different departments. This can pinpoint areas where managers need coaching.
Finally, observe how the results compare to industry or national norms, if this information is available. By seeing where you ‘rank’ on employee relations, engagement and wellbeing tells you whether your company is a good place to work. This boosts your employee retention efforts.
Locate actionable insights for a survey plan
Be realistic about the changes you can implement. Focus on
work environment factors where possible, as these create the most immediate change.
Decide which teams or company levels to prioritize in your strategy. In the video above, Leadership and Talent at the University of Minnesota recommends categorizing employees in engagement surveys as ‘Engaged, Disengaged, Detached or Frustrated’. They suggest you prioritize the ‘Frustrated’ employees – who are highly motivated but who may lack resources or support to perform at their best.
Tips for locating actionable insights
- Find the subgroups with lower engagement/wellbeing etc. Note down all their recommendations for improvement
- Create an action plan for this subgroup. Can you change environmental factors, such as offering greater flexibility in working hours?
- Check your data on employee relations. How can managers be coached to improve motivation, engagement and drive better results?
- Are there development opportunities that would address evident problem areas?
Stay visible with a sound plan of action
You have taken the time to collate information from an engagement survey and analyse it to improve business outcomes. The last thing you want is for your efforts to be ignored!
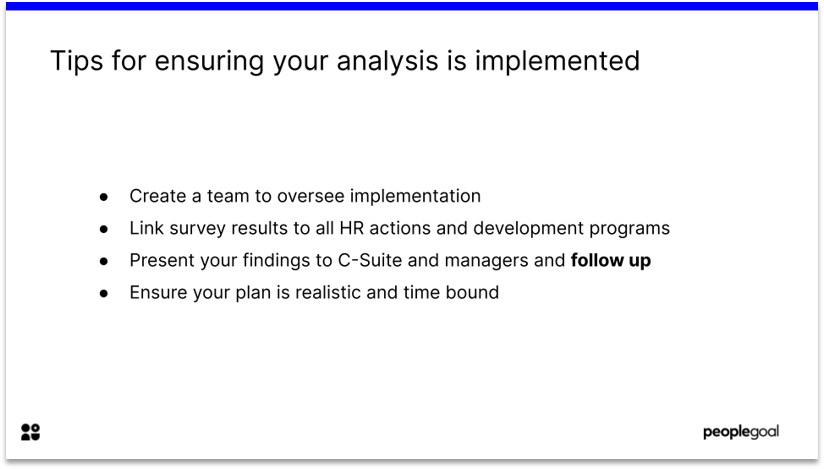
First, create a presentation that clearly outlines your evaluation of the results. Link these results to a new strategy that will improve your people processes based on the evidence.
Provide managers and your C-Suite with an opportunity to ask questions about your conclusions. Sometimes, your executive board do not fully consider the outcome of surveys. It’s essential to ensure their buy-in. Make sure you highlight the strategic benefits of your new strategy.
Create a team to oversee the implementation of changes in light of survey results. SHRM recommends that this team should be comprised of non-senior HR employees headed by a senior figure. Not only does this ensure that changes in light of survey results are implemented, employees feel HR takes their perspective seriously.
Key takeaways for employee survey analysis
Your people deserve to have their voices heard. Employee surveys are transformative if results translate into an effective HR strategy. Put your analytical skills to work so that you can create real organizational change.
PeopleGoal’s survey apps provide an intuitive way to interpret survey data. Why not book a demo to find out more?
Ready to 3x Your Teams' Performance?
Use the best performance management software to align goals, track progress, and boost employee engagement.