If your KPIs vanished for a week, would your team still know what to fix on Monday? Most teams would not, and that is exactly why good KPI tracking software quietly decides who scales and who stalls.
Over the last seven years, I have reviewed performance and analytics platforms, examined over 200 product demos, rollout notes, and user feedback trails. Through this, I gained insight into what works after the trial glow fades.
Not to forget, I have seen brilliant strategies fall apart simply because leaders were reading the wrong numbers, too late, in the wrong place.
So, in this blog, I will help you understand:
- The top KPI tracking tools for real business needs
- Where each tool shines and where it trips teams up
- How to choose fast without second-guessing
Here’s a sneak peek into the best tools I found in my course of usage:
| Tool Name | Best Use Case | Pricing |
|---|---|---|
| PeopleGoal | Tracking Employee Performance And Improving Engagement | FREE 14-day trial. Paid starts at $4/user/month. |
| Databox | Plug-And-Play Performance Dashboards | Starts at $159 per month |
| SimpleKPI | Template-Driven Performance Tracking | Starts at $11 per month. |
| Geckoboard | Real-Time KPI Displays | Starts at $60 per month. |
| Power BI | Microsoft Suite Users | Starts at $14 per user per month. |
| Qlik | Self-Service KPI Analysis | Starts at $200/month for up to 10 users. |
| Klipfolio | Customizable, Real-Time KPI Dashboards | Starts at $120 per month. |
| Asana | Tracking Operational Performance | Starts at $10.99 per user per month. |
| Sisense | Embedded KPI Tracking Inside Products | Custom pricing. |
| ThoughtSpot | AI-Powered Analytics | Starts at about $25 per user per month. |
10 Best KPI Tracking Software in 2026
Here is a detailed, experience-backed roundup of the best KPI tracking software. It covers different business needs, from lightweight dashboards to advanced BI and performance-led tracking. Take a look to get a better understanding of the features you need to track your employee performance data effectively.
1. PeopleGoal
Best For Tracking Employee Performance And Improving Engagement
PeopleGoal is an HR performance and engagement platform that makes performance management feel like a steady rhythm, not a yearly ceremony. You can set goals, track progress continuously, and run frequent check-ins so feedback arrives while the work is still fresh. In practice, that means fewer surprise reviews and more useful coaching moments.
What I find especially strong is the way it links goals across levels. From individual OKRs to team priorities to company direction, alignment is baked into the workflow instead of being stapled on later. Engagement is not treated as a side feature either.
Peer recognition, 360-degree feedback, and pulse surveys help you read the room without guessing. Also, they give employees a voice that shows up in data, not just in hallway chatter. The dashboards pull all this together into a clear story for HR and managers. This makes it easier to spot who is thriving, who is stuck, and where morale is quietly slipping.
Pros:
- The tool has highly customizable performance workflows that let you design goals, OKRs, review templates. And feedback cycles around your real processes, so the platform adapts to your culture rather than forcing your culture to adapt.
- PeopleGoal supports continuous feedback and structured one-on-ones, which keep coaching timely and practical, help employees adjust course early, and reduce the build-up of tension that often comes with annual-only reviews.
- It offers strong goal alignment features that visibly connect individual objectives with team and company targets, so employees can see the “why” behind their work and managers can steer priorities without confusion.
- The platform includes engagement tools such as peer recognition, pulse surveys, and 360-degree feedback, giving you regular sentiment snapshots and making engagement improvement a measurable habit instead of a vague initiative.
- PeopleGoal provides integrations with common HRIS and communication systems, plus clear reporting dashboards, so performance and engagement data live in one place, and managers can act on trends with confidence.
Cons:
- No downloadable or on-premise version.
- The dark user interface option is not available.
Pricing: FREE 14-day trial. Paid starts at $4/user/month.
2. Databox
Best For Plug-And-Play Performance Dashboards
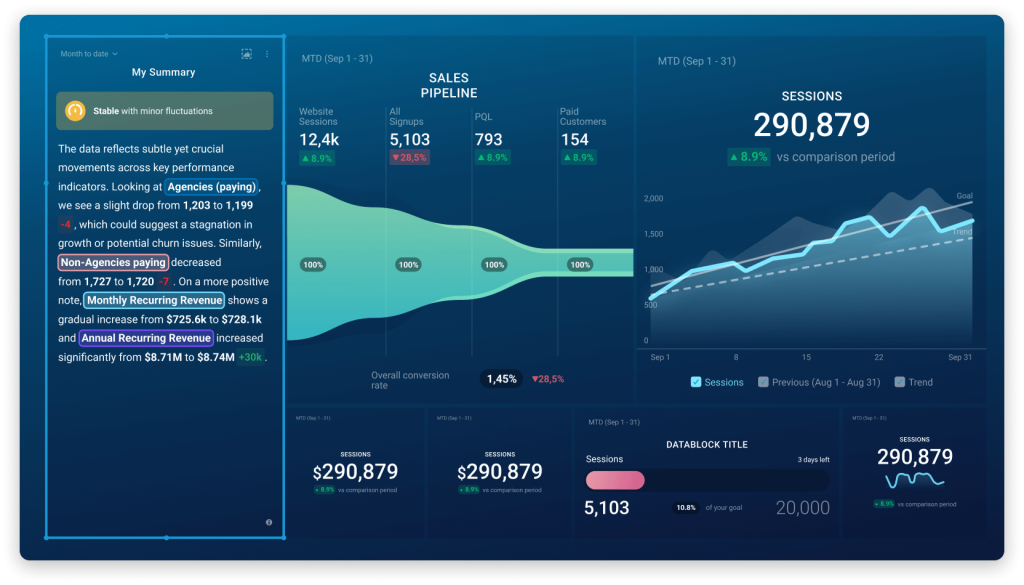
Databox is a cloud dashboard tool that behaves like a quick-start cockpit for KPIs. If your team wants visibility fast, it delivers. You connect a data source, choose a template, and you are already looking at neat charts instead of staring at a blank canvas. That plug-and-play approach is the real draw, especially for marketing, sales, and operations teams who want answers now and do not want to wait for a full BI project.
I have seen Databox work best when leadership wants a shared, real-time view of performance that stays current without anyone babysitting spreadsheets. Dashboards sync automatically, and the product is built to travel well.
You can open KPIs on the web, pin them on an office TV, or check them on your phone between meetings. Databox is not trying to be a deep modeling lab. It is more like a sharp, no-fuss lens that brings scattered metrics into one place and keeps them visible.
Pros:
- Databox has a large library of native integrations that allows you to connect dozens of common tools in minutes, speeding up dashboard setup while still covering most everyday data sources teams rely on.
- The platform includes pre-built dashboard templates and a drag-and-drop editor, making visual KPI creation accessible to non-technical users without sacrificing the polish and clarity leaders expect.
- It offers strong mobile and TV-ready dashboards, so KPIs stay visible across offices and devices, helping teams keep performance front and center instead of hidden in reports.
- Databox provides live data syncing with interactive filters and drill-downs, letting you track changes as they happen and investigate trends quickly without manual refresh cycles.
- The tool includes a free plan that supports a small set of sources, giving teams a safe, low-risk way to test dashboards before committing to paid tiers.
Cons:
- Some data connectors can be fragile and occasionally require re-authentication or fixing broken metrics.
- Custom design control is limited, so deeply tailored layouts or advanced calculations may feel constrained.
Pricing: Starts at $159 per month, billed annually.
3. SimpleKPI
Best For Template-Driven Performance Tracking
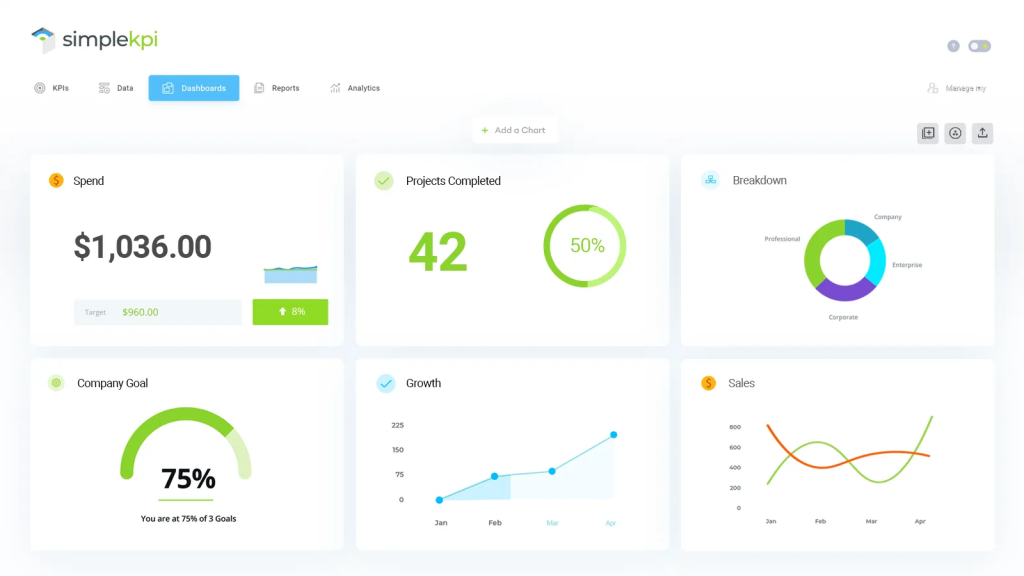
SimpleKPI is the kind of KPI dashboard tool that skips the drama and gets straight to tracking. Instead of asking you to build everything from scratch, it gives you a library of ready KPI templates and industry-style dashboard layouts. That matters when you want useful performance views quickly, not a week-long design exercise.
The visuals are clean and easy to scan, which helps leadership teams spot changes without a learning curve. You can define custom KPIs, pull data from spreadsheets or CSVs, connect through APIs, or enter numbers manually, so the platform fits a range of small business realities.
What I appreciate about SimpleKPI is its focus on clarity over complexity. It does not pretend to be a full BI suite, and that honesty is a feature. You use it when you want a reliable, approachable performance tracker that most teams can adopt in a day and actually keep using.
Pros:
- SimpleKPI has polished, easy-to-read dashboards that prioritize clean visuals and clear metric summaries, helping teams interpret performance quickly without revisiting chart settings every time they log in.
- The interface is designed to be learned fast, so even first-time dashboard users can start tracking KPIs with minimal training and without needing an analyst to set things up.
- It offers a strong library of pre-built KPI templates and dashboard layouts, letting you choose a near-fit structure and adjust it instead of starting from an empty screen.
- The platform supports flexible data inputs through CSV uploads, APIs, manual entry, and automation connectors, so you can track KPIs even when your data lives in mixed tools.
- SimpleKPI uses pricing that is not based on user count, making it easy to add viewers across departments without worrying about escalating costs as adoption spreads.
Cons:
- The tool is purpose-built for KPI tracking, so complex BI modeling or advanced analytics require another platform.
- Branding and deep layout customization are limited beyond the provided styles.
Pricing: Starts at $11 per month, billed annually.
4. Geckoboard
Best For Real-Time KPI Displays
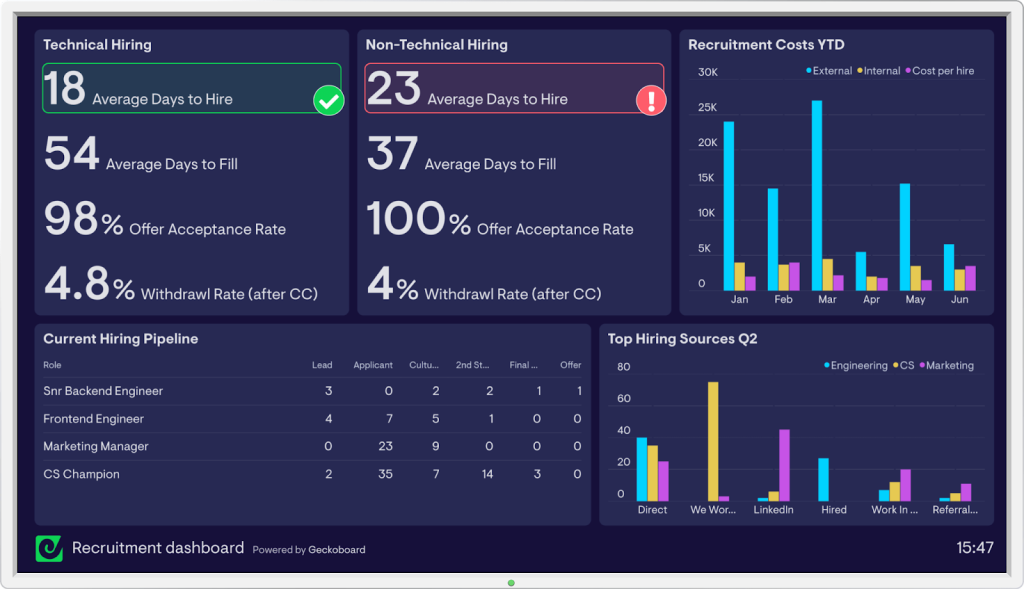
Geckoboard is a real-time KPI display tool that feels like a scoreboard for your business. Teams use it to show live numbers on TVs, wallboards, or shared links, and that shared visibility is the whole point. It pulls data from a wide set of common tools and turns it into simple, well-designed widgets that update automatically.
In operational settings like support floors, sales pods, or marketing war rooms, that real-time pulse keeps everyone honest about where things stand. I like Geckoboard because it makes KPI sharing frictionless. You do not need a designer to make dashboards look good, and you do not need a developer to keep them running.
The product stays intentionally lightweight, which is why it works so well for teams that want instant clarity rather than deep analysis. If your goal is to keep core performance metrics visible and motivating all day, Geckoboard is a focused and reliable choice.
Pros:
- Geckoboard has plug-and-play integrations with many widely used tools, helping you pull live metrics quickly and build dashboards without a complicated setup or long connector hunt.
- The platform offers a clean UI with pre-built widgets, so dashboards look professional by default and teams can launch a clear KPI wallboard without design skills.
- It provides real-time KPI updates automatically, ensuring that teams can react to operational changes as they occur rather than relying on delayed weekly or monthly reporting.
- Geckoboard supports easy sharing through TV display mode, links, and snapshots, making it simple to keep performance visible across distributed teams or office spaces.
- The tool is friendly for non-technical users, allowing managers and team leads to manage and adjust dashboards themselves without waiting on analysts or IT.
Cons:
- No advanced data blending means you cannot combine multiple sources into one computed KPI inside the tool.
- Customization and scaling are limited, and costs can rise if you need many dashboards or viewers.
Pricing: Starts at $60 per month, billed annually.
5. Power BI
Best For Microsoft Suite Users
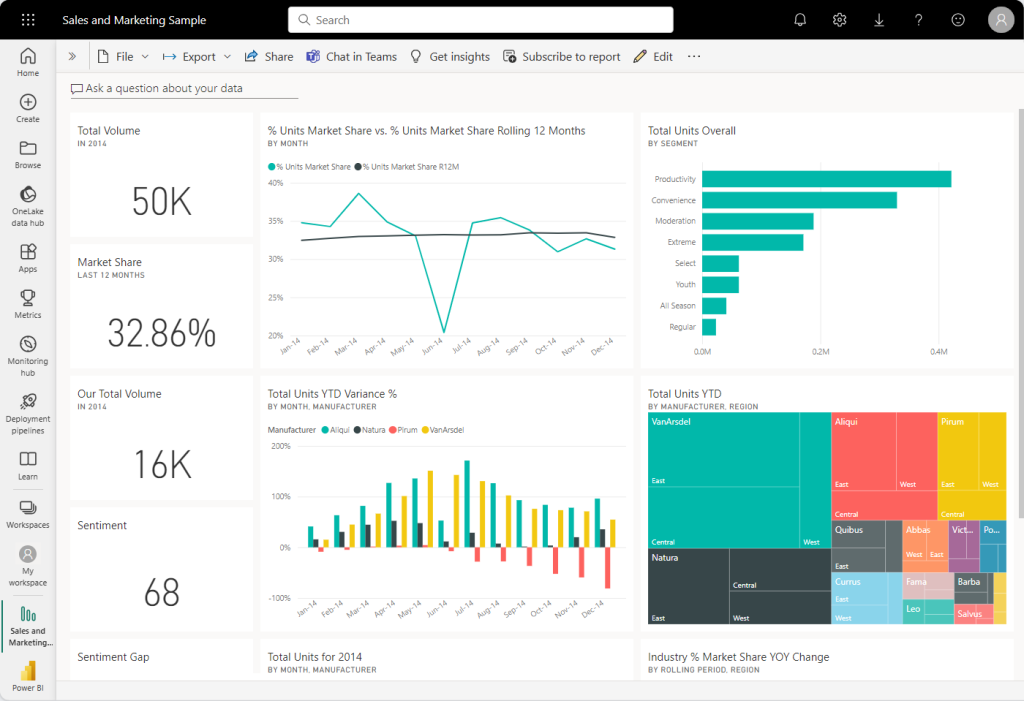
Power BI is Microsoft’s flagship BI platform, and it is best when your data world already leans toward Microsoft. It connects smoothly with Excel, Teams, Azure, and SharePoint, which means many organizations can start without reworking their stack. You can pull data from a wide range of sources, transform it, model it, and publish interactive dashboards that are easy to share.
For beginners, the drag-and-drop report builder feels familiar, almost like Excel learned to speak dashboard. For power users, DAX calculations, AI visuals, and natural language Q&A open the door to deeper analysis.
I have seen teams scale from a single analyst building reports in Desktop to an enterprise-wide reporting culture in the cloud without switching tools. Power BI is not the flashiest in custom visuals, but it is dependable, serious, and cost-friendly for the amount of capability you get.
Pros:
- Power BI has seamless Microsoft integration, making it easy to import Excel models, manage permissions through Azure, and embed dashboards in Teams or SharePoint without extra glue work.
- The platform includes a beginner-friendly report builder with strong default visuals, enabling business users to create useful dashboards quickly while still supporting advanced builds later.
- It offers advanced analytics through DAX, AI-powered insights, and natural language queries, helping teams move beyond surface KPIs into real performance drivers.
- Microsoft provides regular monthly updates and a huge community, so new features arrive steadily, and answers to common issues are widely documented.
- Power BI delivers cost-effective scaling, starting with free Desktop for individuals and affordable Pro licenses for sharing, then Premium options when enterprise distribution is needed.
Cons:
- Advanced modeling, DAX, and large-scale transformations have a steep learning curve for business users.
- Performance can slow on extremely large datasets unless models are optimized or Premium capacity is used.
Pricing: Starts at $14 per user per month. Billed annually.
6. Qlik
Best For Self-Service KPI Analysis
Qlik Sense is a self-service analytics platform that encourages curiosity. Its associative engine does not trap users in predetermined drill-down paths. Instead, you can click any dimension, slice the data in unexpected ways, and Qlik shows what links together or drops away. That makes it excellent for KPI discovery, where the real insight is often hiding in a connection you did not plan for.
The drag-and-drop interface is friendly to business users, while power users can extend dashboards with scripting and set analysis. Deployment flexibility, cloud, on-prem, or hybrid, is also a real advantage for organizations with governance needs.
In my experience, Qlik works best when you want to give teams the freedom to explore numbers on their own, without sending every question to an analyst queue. It feels like handing users a flashlight and letting them explore the cave, rather than giving them a postcard.
Pros:
- Qlik uses associative data exploration that lets users filter in any direction, helping them uncover relationships, exceptions, and patterns that static dashboards often miss completely.
- The platform supports true self-service dashboard building, so non-technical users can create, refine, and reuse KPI views without waiting for analysts to translate questions into reports.
- Qlik offers flexible deployment across cloud, on-prem, and hybrid setups, giving organizations control over data governance, residency, and rollout pace.
- It provides scalable, in-memory performance that stays fast on large datasets when sized correctly, making interactive KPI analysis feel smooth even with complex models.
- The tool includes strong embedding and API capabilities, allowing teams to integrate KPI dashboards into products or internal portals when analytics must live inside another experience.
Cons:
- Advanced modeling and scripting require training before teams can use the platform at full strength.
- Pricing and add-ons can become expensive as user counts, data volumes, or connector needs grow.
Pricing: Starts at $200/month for up to 10 users. Billed annually.
7. Klipfolio
Best For Customizable, Real-Time KPI Dashboards
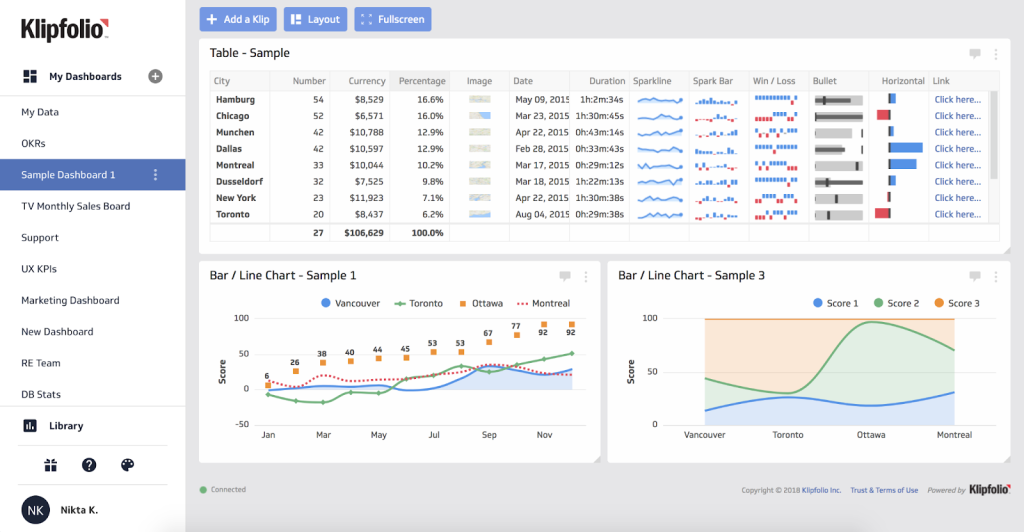
Klipfolio is the dashboard tool you pick when your KPIs are not simple exports but living formulas. It lets you build widgets called Klips, where you can write calculations, blend multiple data sources, and shape visualizations to match your measurement logic.
That flexibility is powerful when performance metrics span several systems and need custom rules. Templates help you start quickly, but the real strength shows up when you want dashboards that feel designed around your business, not around a generic layout.
I also like the unlimited user model, because it removes the usual “who gets access?” debate. You pay for capability and scale, not headcount. Klipfolio is not the simplest product in this list, but for teams that want control, variety, and real-time versatility in KPI monitoring, it is a strong and practical option.
Pros:
- Klipfolio has deeply customizable dashboards and widgets, allowing you to build KPIs with your own formulas, layouts, and logic instead of being limited to fixed template calculations.
- The tool supports complex data blending across multiple sources, which is ideal when meaningful KPIs require combining marketing, sales, finance, or product data into one metric.
- It offers a large integration library plus API and SQL support, so you can bring in data from common cloud tools and from niche systems with custom queries.
- Klipfolio includes unlimited users on its plans, making it easy to share dashboards widely across teams or even clients without per-seat pricing blocking adoption.
- The platform is known for solid onboarding and responsive support, which helps teams handle the learning curve and unlock advanced custom dashboards faster.
Cons:
- Advanced customization has a steep learning curve, especially for teams without technical support.
- Refresh frequency and data volume depend on plan level, so near real-time demands may require upgrades.
Pricing: Starts at $120 per month. Billed annually.
8. Asana
Best For Tracking Operational Performance
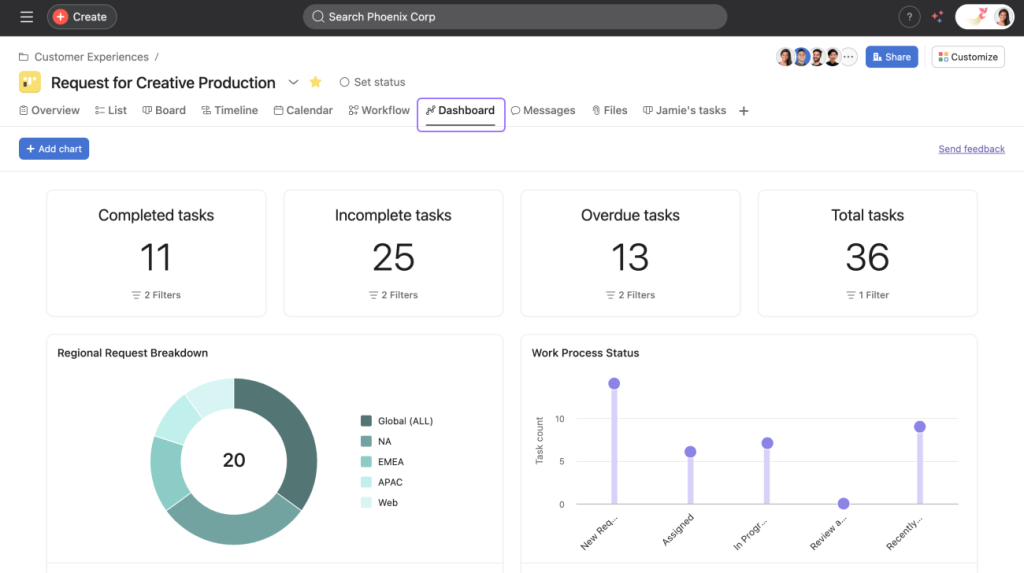
Asana is primarily a work management tool, but it doubles as an operational performance tracker because it captures execution data in real time. When you organize work into projects, tasks, deadlines, and owners, the platform naturally produces KPIs like completion rates, overdue volume, throughput, and workload balance.
Dashboards show these signals live, so operations leaders can spot bottlenecks early rather than waiting for a post-mortem. Custom fields let you tag tasks with metrics that matter to your workflow, while automation rules reduce manual follow-ups. It integrates smoothly with collaboration tools, which keep project chatter and progress in one place.
In practice, Asana does well when operational performance is tied to delivery and accountability. It will not replace a BI suite for deep financial modeling, but for tracking how well work is flowing, it gives a clear, practical, and fairly enjoyable view.
Pros:
- Asana has robust task and project management that clarifies ownership, deadlines, and dependencies, which supports consistent tracking of execution KPIs across teams and reduces operational ambiguity.
- The platform offers real-time dashboards that automatically summarize task completion, overdue trends, and workload shifts, letting managers detect delivery risks early without manual status chasing.
- It includes custom fields and automation that let you track operational metrics your way, while minimizing repetitive updates and ensuring KPI tags stay accurate as work moves.
- Asana provides strong integrations with common collaboration, planning, and dev tools, helping operational data stay connected across your stack rather than scattered.
- The system offers Timeline and Workload views that help you manage scheduling and capacity, so operational performance issues become visible before they affect outcomes.
Cons:
- KPI and reporting depth are limited compared to dedicated BI platforms.
- Per-user pricing can become costly as teams scale.
Pricing: Starts at $10.99 per user per month (billed annually).
9. Sisense
Best For Embedded KPI Tracking Inside Products
Sisense is a KPI tracker software built for teams that want analytics inside their product, not sitting in a separate BI corner. It lets you create interactive KPI dashboards, blend multiple data sources, and embed the results into customer-facing apps or internal portals with white-label control. Its in-chip analytics engine is known for speed, which matters when you are serving dashboards to many users at once.
Deployment is flexible, cloud or on-prem, so teams with strict data policies can still use it without rearranging their infrastructure. The APIs and SDKs are strong, giving developers fine-grained control over access, theming, and how dashboards behave in the host app.
In my experience, Sisense is not a casual weekend setup. It needs engineering attention, but when embedded analytics is part of your strategic offering, it delivers the horsepower and flexibility to make that experience feel native and reliable.
Pros:
- Sisense is built specifically for embedding, so you can deliver white-label KPI dashboards that feel native inside your product and keep analytics tightly aligned with your user experience.
- The platform uses a high-performance analytics engine that keeps dashboards responsive on large and complex datasets, which is critical when embedded KPIs must load fast.
- Sisense supports strong scalability, making it suitable for products where many end users view live dashboards at the same time without performance dips.
- It offers flexible deployment across cloud and on-prem environments, helping you meet security, residency, or infrastructure requirements without sacrificing embedded capability.
- The tool provides rich APIs and broad connector support, enabling developers to automate KPI experiences, manage users programmatically, and integrate data from many services.
Cons:
- Implementation is not plug-and-play and usually needs developer and data modeling time.
- Achieving a fully native look and feel in embedded views can take extra customization effort.
Pricing: Custom pricing.
10. ThoughtSpot
Best For AI-Powered Analytics
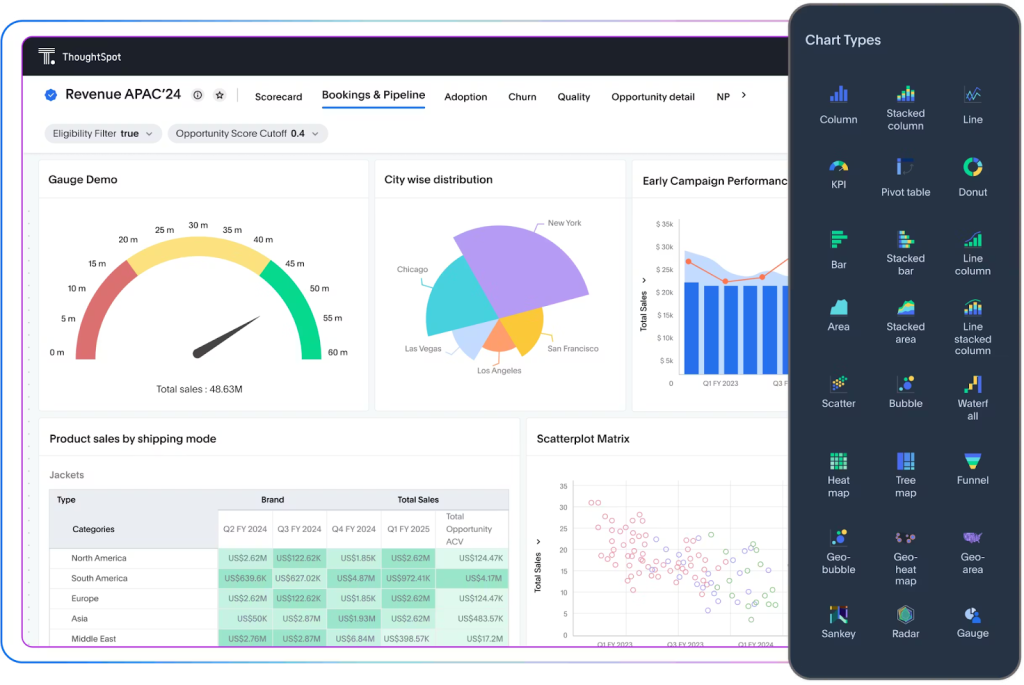
ThoughtSpot turns KPI analysis into something closer to a conversation than a report. Instead of navigating a maze of dashboards, users type questions in plain English and get instant charts or answers right away. That search-first approach makes analytics approachable for non-analysts and fast for experts who want to test a hunch.
The AI engine also surfaces trends, correlations, and anomalies automatically, which is like having a curious analyst quietly tapping you on the shoulder with “hey, look at this.” ThoughtSpot connects strongly to cloud data warehouses, so results stay live and current rather than frozen snapshots.
I have seen it work best in organizations that want many people exploring data daily without needing a BI specialist to translate every question. It feels modern, quick, and genuinely user-empowering.
Pros:
- ThoughtSpot offers a natural language search interface that lets users explore KPIs by asking questions directly, removing the need for SQL and making analytics accessible to teams beyond analysts.
- The platform includes AI-generated insights that automatically highlight trends and anomalies, helping you discover performance drivers quickly, even when you do not know what to look for.
- It provides strong integrations with cloud warehouses and business data sources, so KPI analysis remains live and up to date without manual refresh or export routines.
- ThoughtSpot uses a scalable architecture designed for large datasets, keeping response times fast as your data grows and ensuring users stay engaged instead of waiting.
- The tool supports interactive dashboards that blend monitoring with easy drill-down into the search layer, giving users both a stable KPI view and a quick path to deeper answers.
Cons:
- The interface and search-first workflow can feel unfamiliar at first, so training helps adoption.
- Visualization customization and embedding options are more limited than in some BI competitors.
Pricing: Starts at about $25 per user per month, billed annually.
How I Chose These KPI Tracking Software
Picking KPI tools is easy if you only read feature pages. Picking the right ones for real teams is tougher. For this list, I used a clear, repeatable set of checks focused on what actually affects day-to-day tracking, adoption, and decision-making. Here is the exact lens I used to narrow the field.
1. Real-World User Feedback And Ratings
I reviewed user ratings and long-form feedback on trusted review sites, then looked for repeated themes. Consistent praise or recurring complaints mattered more than isolated opinions. Tools that felt reliable in real usage rose to the top, while those with frequent friction fell behind.
2. Core KPI And Performance Features That Matter In Practice
I checked whether each tool handles the basics well: KPI creation, goal or metric tracking, dashboards, reporting, and visibility across teams. I also matched tools to their strongest use case, like PeopleGoal for performance plus engagement, or Databox for fast dashboards. If a tool’s core tracking felt incomplete, I excluded it.
3. Ease Of Use For Both Beginners And Power Users
I evaluated how quickly a new user can build a useful dashboard and how smoothly a power user can go deeper. Simple tools had to prove speed and clarity. Advanced tools had to justify complexity with real control. I prioritized platforms that teams can adopt without heavy training.
4. Support Quality And Onboarding Experience
I looked at how well vendors help users during setup and troubleshooting. That included responsiveness, documentation quality, product tours, and training resources. KPI tools fail when support is weak, so strong onboarding and dependable help were non-negotiable.
5. Value For Money Based On What You Actually Get
I compared pricing against what is included at each tier, not just the headline cost. Transparent plans and fair limits scored well. I also considered how pricing scales as teams grow, especially for per-user tools versus flat-rate models.
6. My Practical Lens And Industry Expert Signals
I leaned on what typically drives success in KPI rollouts: adoption rate, dashboard clarity, alignment strength, and fit for different team styles. I also cross-checked these judgments with credible expert viewpoints to avoid trend-chasing and keep the list grounded.
My Top 3 KPI Tracking Software
To make your decision easier, let me narrow this list down to three tools you can confidently start with. These picks cover the most common KPI tracking needs without making you sift through every option.
1. PeopleGoal
PeopleGoal takes the top spot because it blends KPI tracking with real performance and engagement management. You can set aligned goals, run continuous check-ins, and tie results to morale signals like pulse surveys and peer feedback. I picked it first since it does not just show numbers; it helps you improve the behaviors behind those numbers.
2. Databox
Databox earns second place for its fast, plug-and-play dashboards. You connect your tools, choose a template, and your KPIs start rolling in with almost no setup fuss. I put it in the top three because it gives teams instant visibility across devices, which is perfect when speed and clarity matter more than deep BI modeling.
3. Power BI
Power BI rounds out the top three for teams that want serious analytics with a familiar Microsoft feel. It handles large datasets, supports advanced calculations, and produces interactive dashboards that scale from one analyst to the whole company. I chose it because it delivers strong depth for KPI tracking without forcing a complete shift in most Microsoft-based workflows.
Ready to Pick the Best KPI Tracking Software?
So, what does a smart KPI tracking choice look like in real life? It starts with clarity. You want dashboards that make priorities obvious, data that stays dependable, and reports that help you act before small dips turn into big problems. The right tool should fit your team’s pace, whether that means quick weekly snapshots or deeper trend analysis.
It should also be easy enough that people actually use it, not just admire it during setup week. Aim for a platform that scales cleanly and keeps metrics tied to outcomes, not busywork.
That said, I lean slightly toward PeopleGoal because it pairs KPI dashboards with goal alignment, OKR tracking, continuous feedback, and regular check-ins. Those features keep performance measurable and improvement constant.
Frequently Asked Questions

2. What is a KPI tracking system?
A KPI tracking system is a method or tool that records key performance indicators, monitors progress against targets, and shows trends over time. It helps teams measure whether goals are being met, spot gaps early, and improve decisions.
3. How to track your KPI?
Start by defining clear KPIs tied to goals. Set targets, choose a tracking tool, and collect data regularly. Build a simple dashboard, review results on a set cadence, and adjust actions when indicators rise or fall.
4. What are the 4 P's of KPI?
The 4 P’s often refer to a simple KPI logic: Purpose (why the KPI matters), Process (what drives it), Performance (the measurable result), and Progress (how it changes over time toward the goal).
5. How to build a KPI tracker?
First, list your key goals, then choose KPIs that reflect them. Also, define formulas, targets, and data sources. Next, create a tracker in a dashboard tool or spreadsheet, automate data updates if possible, and review it on a weekly or monthly basis.
Ready to 3x Your Teams' Performance?
Use the best performance management software to align goals, track progress, and boost employee engagement.