February 3, 2015
Conducting Sentiment Analysis to Measure Employee Engagement
At PeopleGoal we feel that if we're able to increase employee engagement in performance management we can give some really valuable data back to our clients.


One of our central theses at PeopleGoal is that if we're able to increase the employee engagement in performance management then we can give some really valuable data back to our clients; data that will help management make accurate decisions about performance, and about rewarding the right behaviors in their employees. We're interested in capturing as many employee related data points as possible; that's why we're piloting a new feature called Employee Sentiment Analysis with a limited set of our clients.
The Idea
The idea is to give our clients a very simple and easy way to capture employee 'sentiment' (or 'happiness') over an extended period of time. We think that engagement surveys are great and all, but they are backwards looking - imagine if you had a daily engagement survey and could map out the results over time. It would more accurately reflect the change in happiness and maybe you could even tie that result to actions made in the company. The problem is this:
How do you capture daily employee sentiment without annoying or spamming your employees in the process?
We think we have good engagement with our customers already. On average, our users log into PeopleGoal once a week to update their goals or give/request feedback. So since we already have employees logging in, we didn't think it was a good idea to send out surveys over email. Instead we asked ourselves what the simplest form of capturing engagement/happiness was. We boiled it down to one simple question:
How are you feeling today?
The answers are limited to: Up, Flat and Down. We started with Happy/Flat/Sad but felt that these were slightly too emotional; however maybe Up/Down is too 'bipolar' - we're still open to idea's here! We also chose to make the sentiment process anonymous to encourage people to give accurate responses without fear of reprisal.
The Execution
We decided to implement a simple pop-up when a user logs in for the first time that day, asking how they were feeling. We don't expect users to log in every day for a performance management system but the idea is that we could collate responses across the companies account to give a more accurate representation of sentiment. We might have 3 responses on Monday, 5 on Tuesday, 1 on Wednesday etc. but the net result would be reflective of the company as a whole.
The trick with sentiment analysis is to represent the data in a useful and actionable way for management. We designed a sentiment report and implemented it company-wide for our pilot customers. The idea was that we would show three things simultaneously:
- The movement in total employees over time
- The number of responses to the sentiment question
- The 'net sentiment': that is the number of positive responses less the number of negative responses.

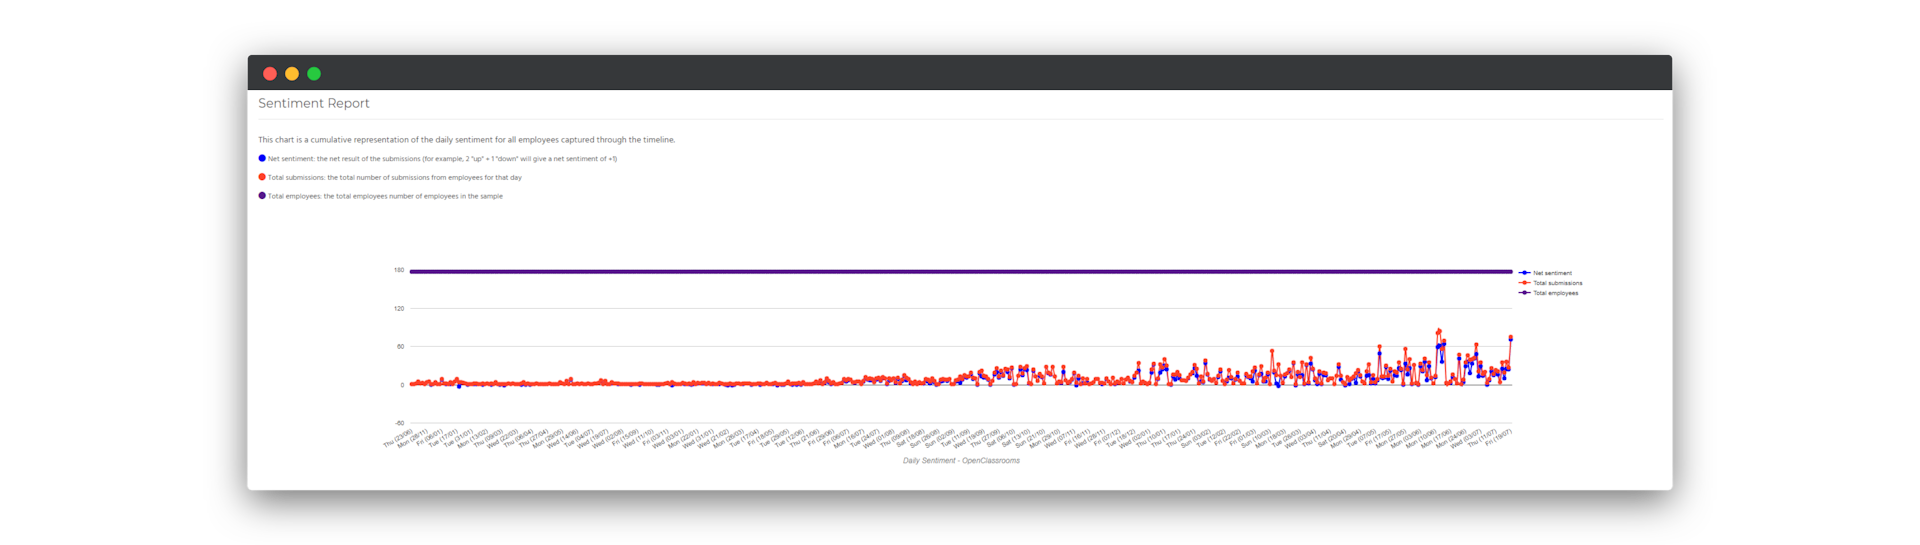
A 'net sentiment' score of +2 would indicate a better than average sentiment across the sample. An increasing difference between (2) and (3) would indicate a worsening of sentiment; i.e. the closer the net sentiment score is to the line representing number of responses, the better the company sentiment would be. By including the total number of employees management also has a reference point for how many responses were captured and whether the data is significant (subjectively speaking)
We also gave our clients the ability to filter the sentiment report by team and department; so you can drill down into engagement across your business units.
The Results
Below is a sample (reproduced with permission) from one of our smaller clients for their sales team; think we can draw some interesting conclusions even with the small data set at this stage:Some observations:
Point 1: One response, one positive sentiment. So this is a positive result; the net sentiment line is exactly the same as the total responses so we can assume that 100% of the respondents are 'up'. Obviously it would be better if all 4 team members had responded.
Point 2: Here we had a diverging net sentiment score from the total responses (sentiment of +1 vs 3 total responses); the idea is that the further apart these two lines are the worse the team is feeling.
Point 3: All four team members responded positively; so the ideal result. This is unlikely to be achieved on a bigger scale but hopefully you get the point!
Ideas for improvement
We may choose to represent the graph over a weekly period, instead of daily; while still capturing the data daily. Let us know what you think in the comments below!
Feel free to read out if you have questions about the report using the email contact@peoplegoal.com.
Ready to see PeopleGoal in action?
Start your free trial today.


Subscribe to our newsletter
The latest news, articles, and resources, sent to your inbox weekly.
© 2024 PeopleGoal, Inc. All rights reserved.